Lessons in AI-Assisted Coding
Posted: 2026-01-18
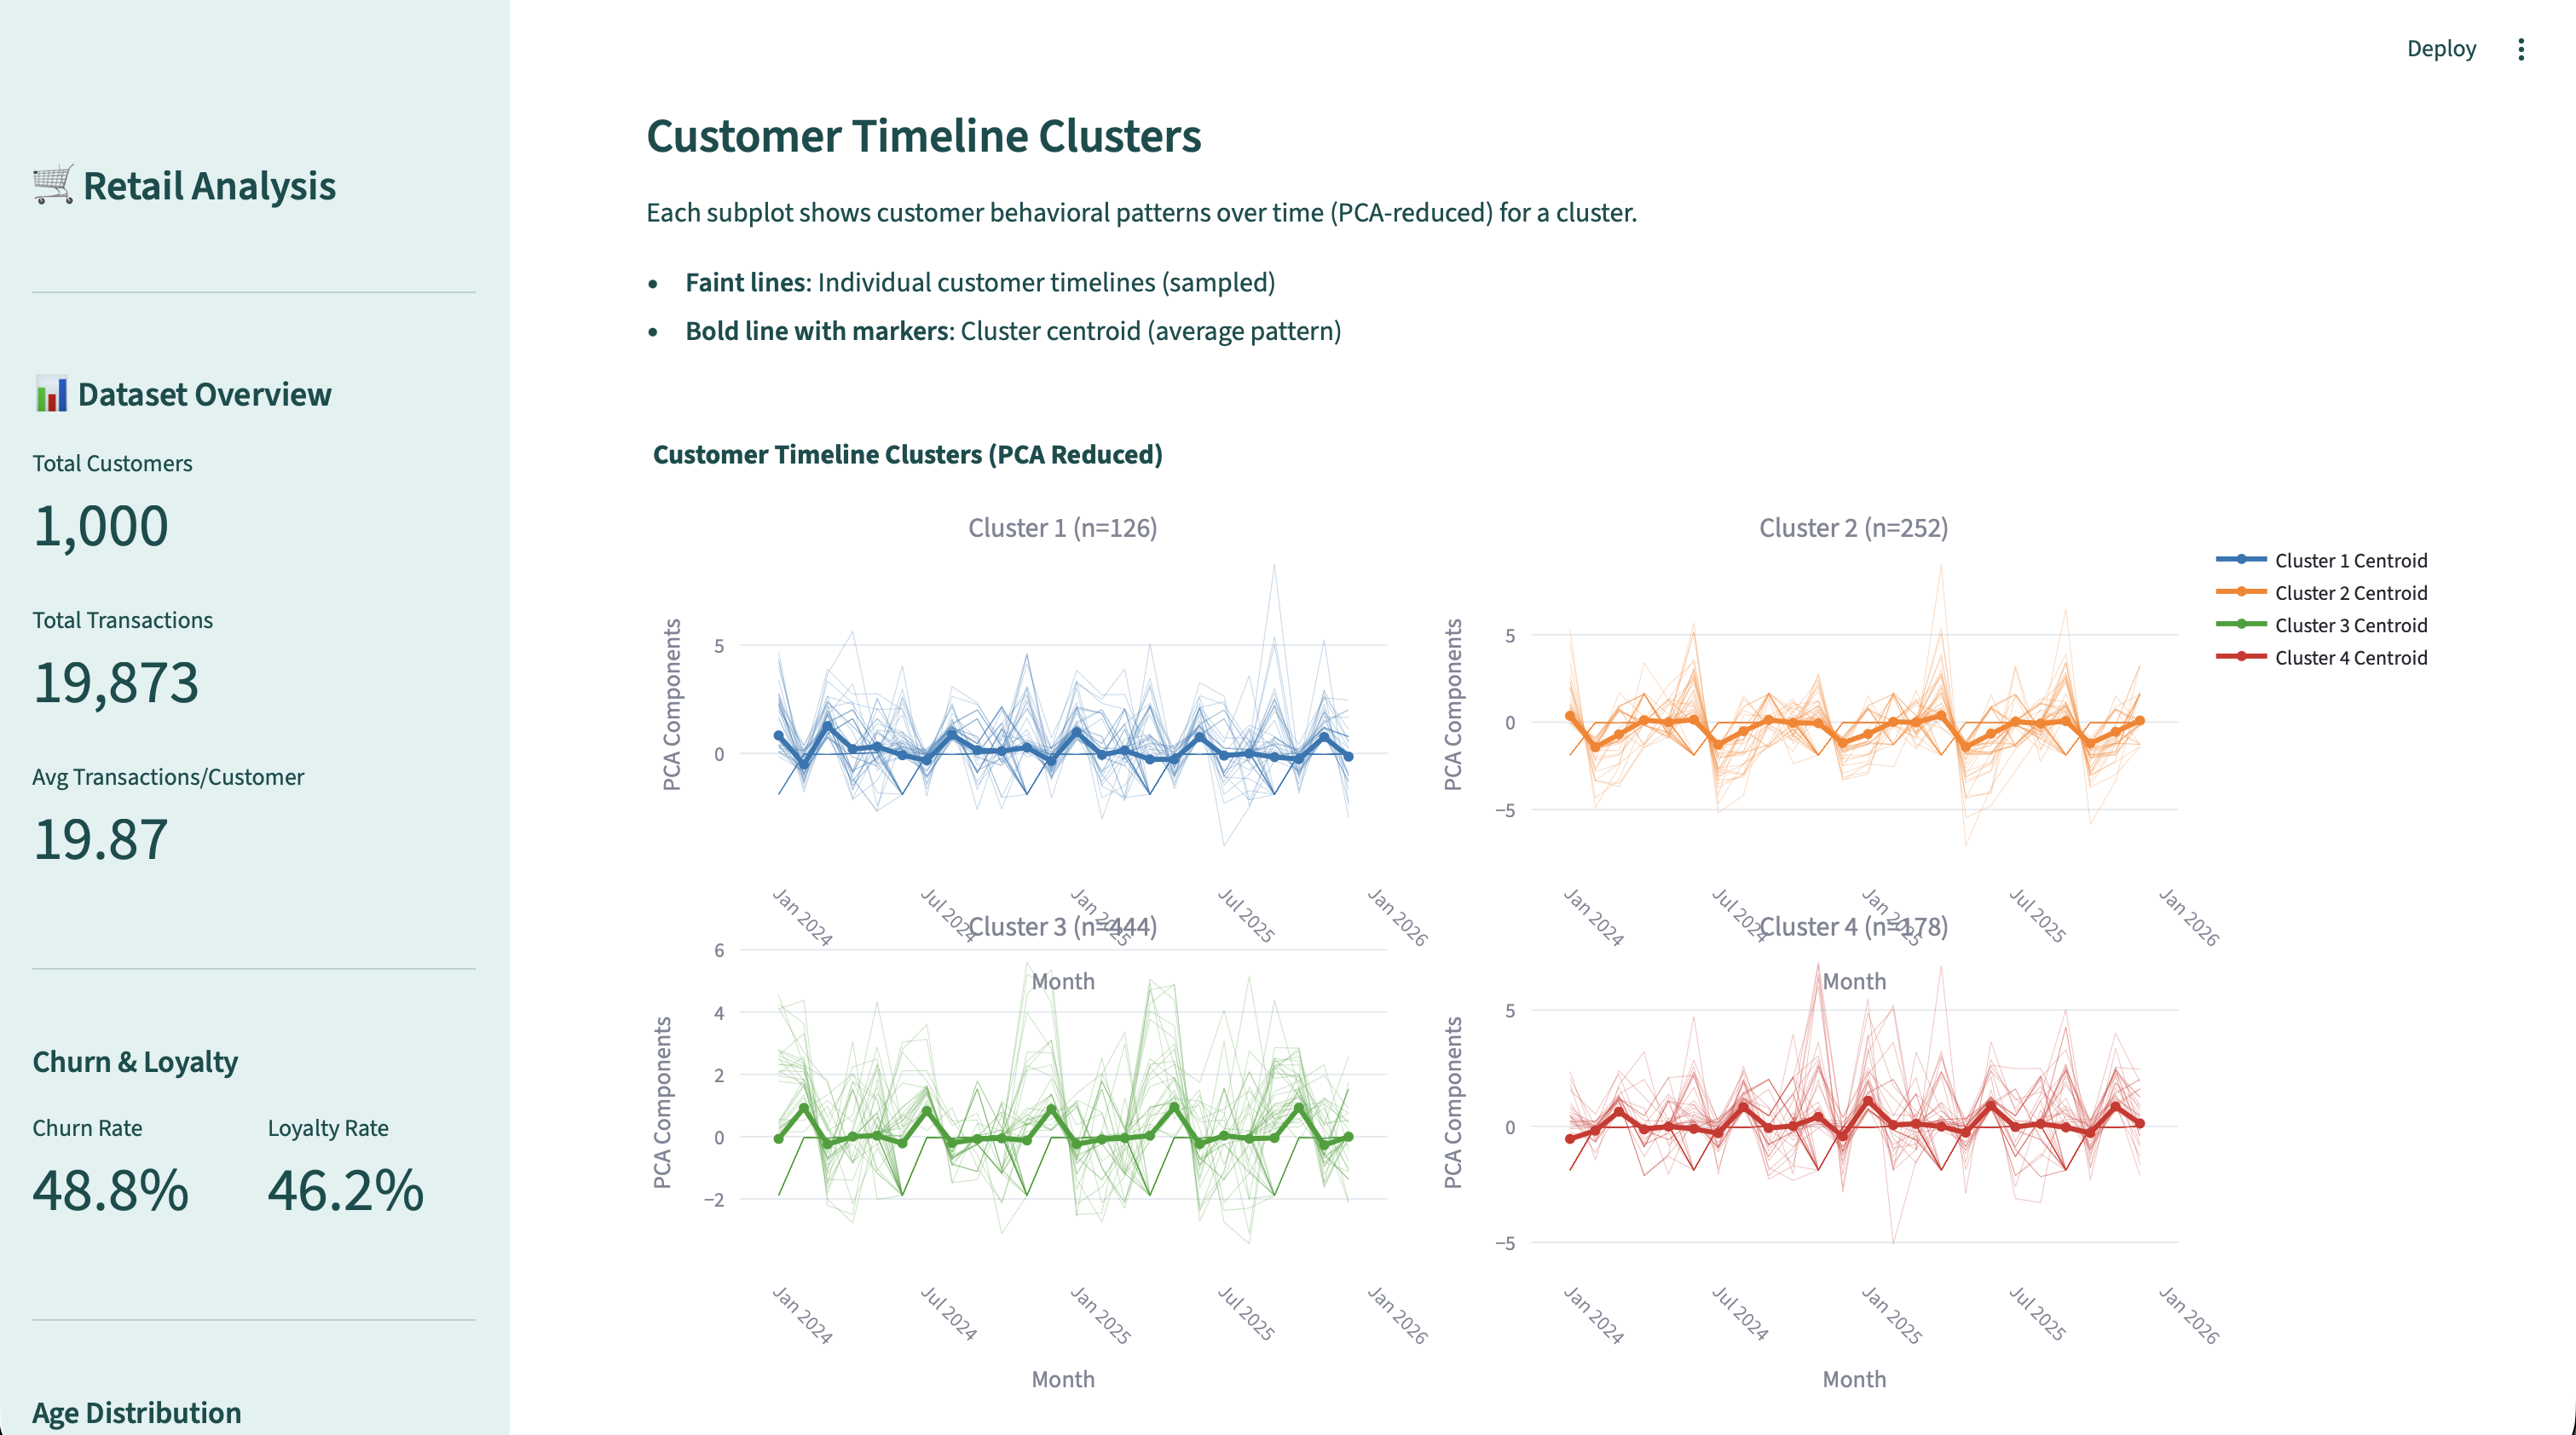
Not to overly anthropomorphize an AI agent, but I’ve started using an AI coding agent as if it was a kind of collaborator (a chatty one!) to create a Python application. I've specifically been using Anthropic's Claude Opus 4.5, released Nov. 2025, to build a data visualization Streamlit app. It has been both enjoyable and challenging. I’ve also leveraged the same agent for generating synthetic retail data for use in my demo app, which is a much, much more challenging task if one wants statistical patterns present.
Below, you will find a list of what I’ve learned in my experimentation and the main takeaway that comes to mind, is that this was more time-consuming than I initially thought, due to some errors that were hard to track down and issues with generated data. Also, there was extensive back and forth when it came to more advanced analytics code such as setting up time series clustering experiments (I felt I should at least try!). That being said, it did significantly lower the barrier to getting started and when building visulizations and it's nice to get an appealing look and feel out-of-the-box. I don't offer an exhaustive list of advice, but do encourage you to be critical and to learn as much as you can from various sources about the practical use of AI coding tools (and their inner workings if that interests you).
Major Lessons
- Start simple. Before leveraging a coding agent, define clear goals and specifications. When using the agent, ask for small changes as you go along.
- Spot check data points. If you absolutely want to use an agent for generating data, ensure you always look at a handful of generated data points for logical values plus perform comprehensive data exploration and visualization (especially with more complex data such as time series like I was doing for my customer transaction histories).
- Use the agent for the common/basic stuff. It works pretty well to lean on the agent for theming (think html/js/css) and debugging the generated code.
- Don't go it alone. If you don't understand a concept or approach used by the agent, find a good, human-made resource (aside: I have references below and one is the Statistical Learning YouTube series from Stanford by Hastie and Tibshirani, an excellent intro. to common ML approaches - resources like this). Keep a close eye on any anaysis code. You can also validate this analysis or machine learning-related code with good evaluations (check the calculations and look up docs for libraries used if you are unsure).
- Use the agent to help in compiling data questions. An agent can be a decent help at coming up with the types of questions you may want to explore for your particular dataset which could give you ideas for data visualizations to add to the normal descriptive statistics and other stats approaches for exploring data.
- A picture speaks a thousand words. If you are building other types of apps, building out temporary visuals could really help shed light on problems quickly.
- Track successes and failures for error analysis. This is actually a fun exercise. Keep a running tally of when the code has a bug vs. does not (binary values make for good error analysis later on to evaluate if this tool is working for you). You could also track how helpful other responses are (helpful vs. not helpful). Then take a look after some time and see how it's going!
Detailed Thoughts
Idea 1: Before even instructing the generation of code (or data), decide what kind of app you wish to build, what your goals are. For example, if building a data analysis app, look at your data and come up with a list of reasonable questions you would like answered about the data (what you’d typically do in EDA) - these could lead to simple visualizations, more advanced approaches with classifiers (e.g., churn prediction), time series analysis, or survival analysis (for time-to-event data).
After creating a data dictionary in a markdown file (data point field names and the definitions), the first thing I asked of the agent was:
"given the DATA_DESCRIPTION.md, what are some good data exploration questions I could ask to better understand user behavior and health of the store"
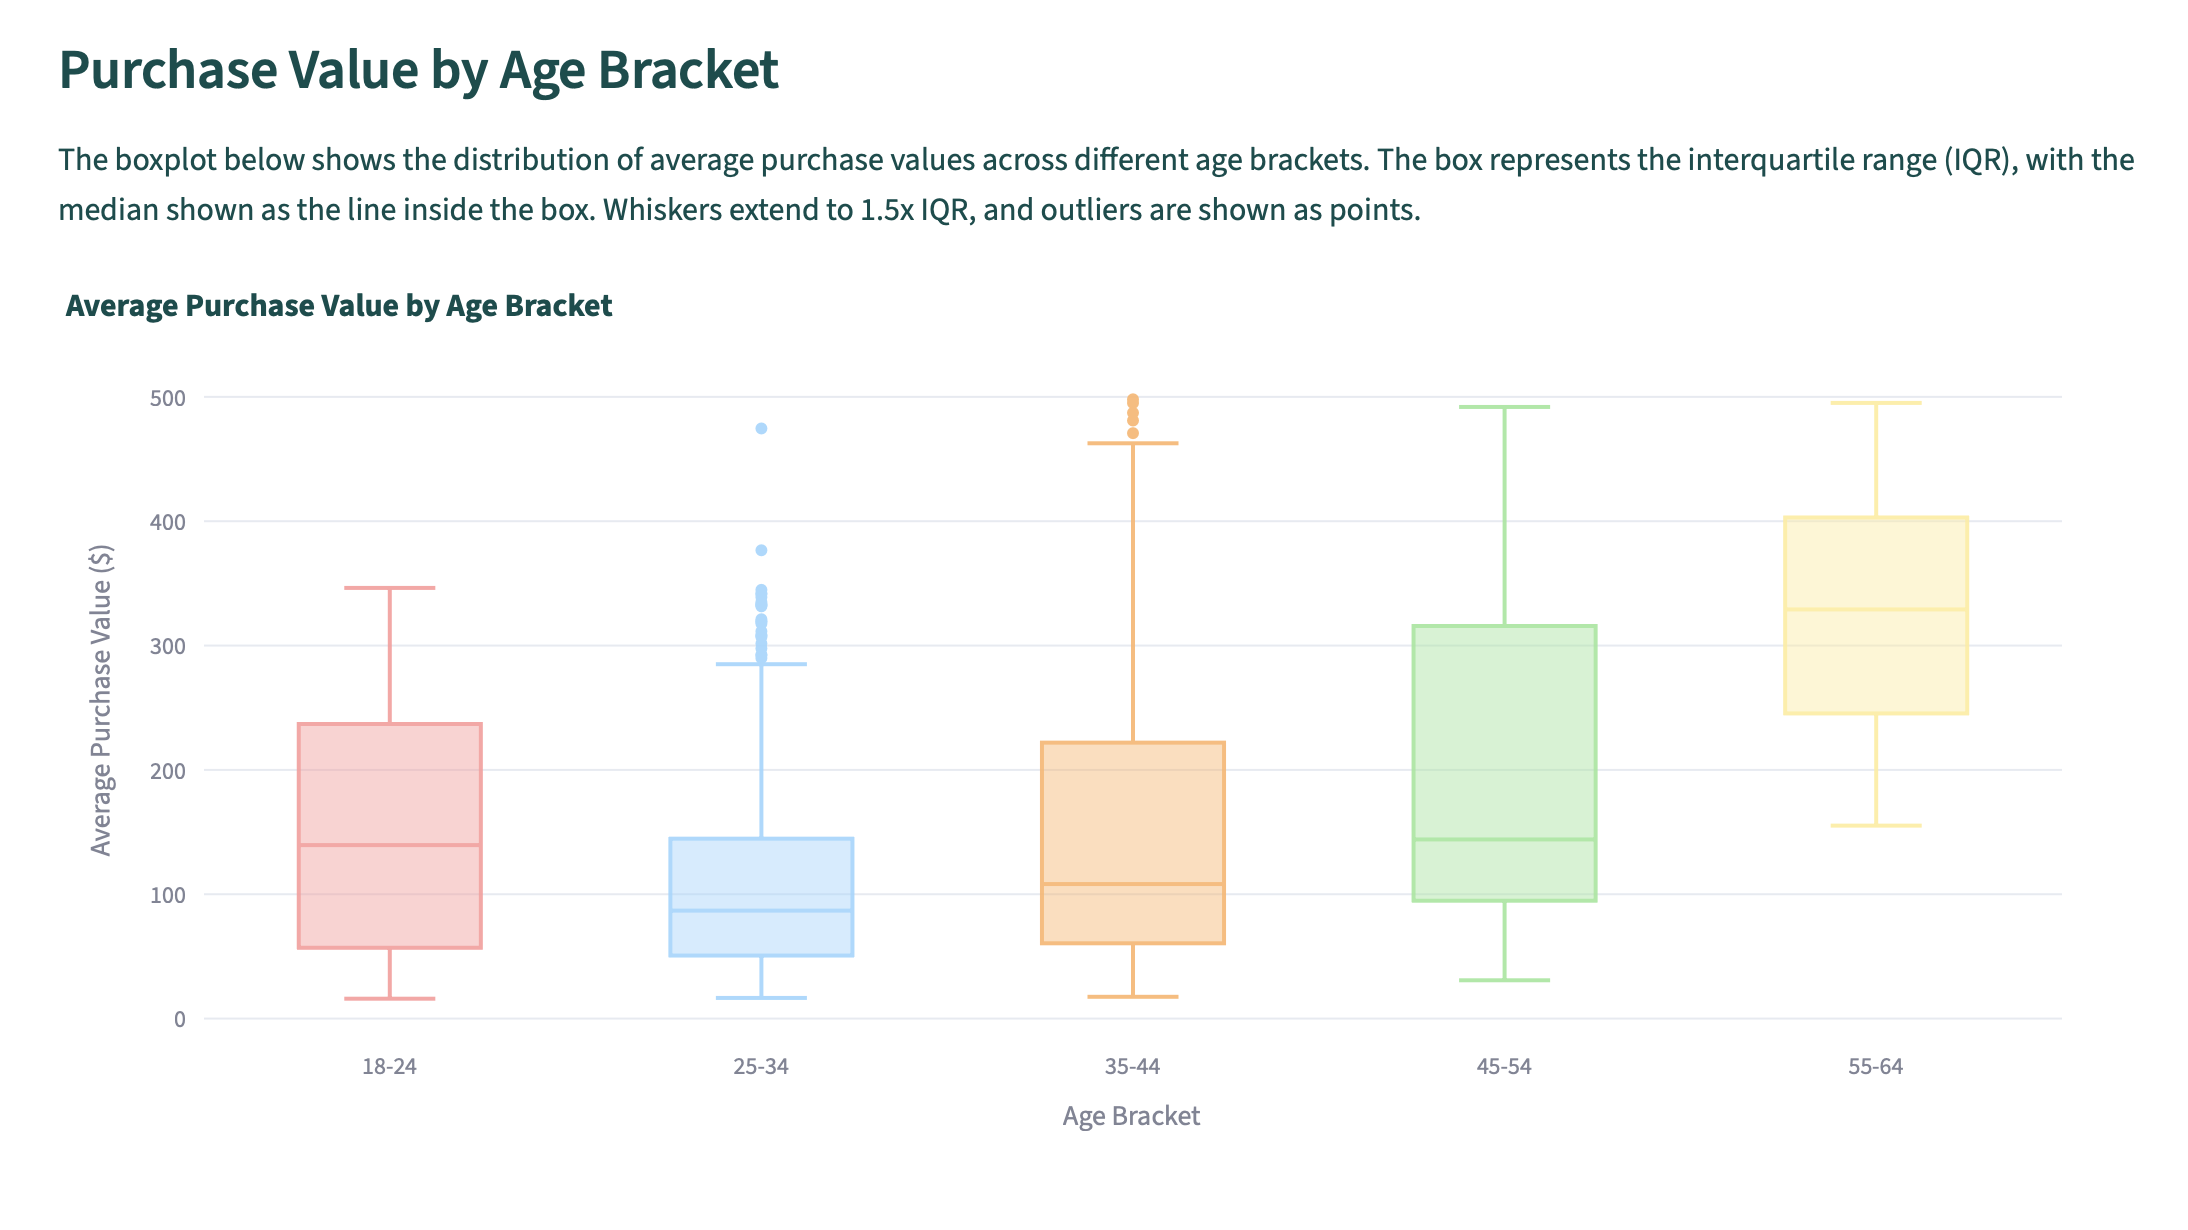
Which led to an interesting list of questions for EDA purposes (some listed on the project repo) that got me thinking more deeply about different aspects of the data like "How does avg_purchase_value vary across income_bracket and age groups?" which I decided to explore with a box plot.
Idea 2: It’s a good idea to use of a package manager like uv, and have the agent create a simple pyproject.toml file for the Python project as well as update the main README with instructions on usage. Manage the use of uv on your own so you are aware of how things work.
I set up a simple Python package first by instructing the agent as follows.
"start a python package that uses uv (start a pyproject.toml) called retail_analysis and add install instructions to the README.md. the package should have a single file called data_viz.py where the data visualization code will go."
Idea 3: When starting a project like a Streamlit data visualization app, start very simple with placeholders only that will help frame the visuals you’ve thought of. You can also do this: use the agent to categorize the data questions you’ve come up with (you can add more with suggestions by the agent). Then have the agent generate an app structure that maps the types of questions to a tab.
To begin coding on the Streamlit app I instructed the agent to essentially stub out some tabs for me with a placeholder for their purpose.
"create a simple streamlit app with a simple teal and white theme (default to light) that has one tab per data question theme above (7 tabs). These tabs should not have any plots or elements yet except for a 1-2 sentence text description of the type of analysis that tab represents."
In the end I didn't need all 7 categories, so if starting again, I'd create just 2 or 3 tabs for the most critical EDA categories.
Idea 4: The agent may try to put all code the app.py file, or whatever your main application file is called, but you can create a package within your project that abstracts away the functions and classes you’ll use in the app.py as I instructed above before even starting on the web app code. You may want a file for visuals and a file for stats and perhaps if doing more advance analytics, a separate file for each type. If performing any data generation, this could make a nice Python class. Try to abstract and simplify every time you verify the code yourself (which should be often, otherwise very quickly you will have thousands of lines of potentially boilerplate code in one file and that makes the project much less manageable and readable). Agents usually create one function per use case or request unless told to reuse code, but in fact these can be refactored usually into one or a few generic functions to reduce the size of the codebase.
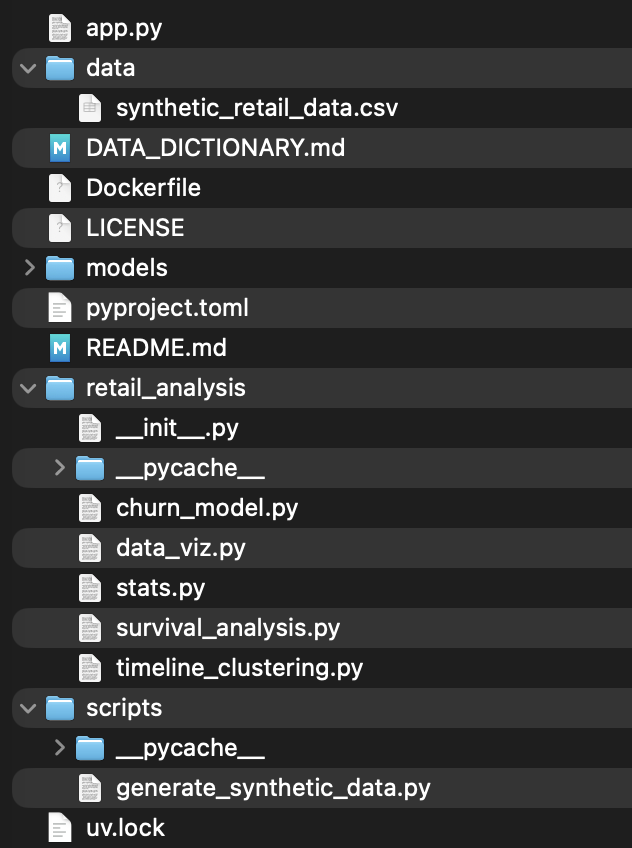
Here's is the structure currently of my codebase with a package called retail_analysis.
Idea 5: When using synthetic data to potentially train classifiers or for finding structure in data with clustering, ensure your data is modeled after real-world distributions and correlations as much as possible (e.g., you do not have an outcome variable that is simply a coin flip / random). Also, spot check a few data points in the dataset manually to make sure it is logical in form.
Note, I was creating a demo app, so the stakes were lower than something that goes into production. Originally, I was going to use a public, open dataset and I created the first bits of the web app with that data. In seeing some stats I noticed I had 1 million rows, but also 1 million customer IDs which was weird for a retail transactions dataset where we are interested in customer behavior. Ideally we want to know over time how the customer behaves, but if there's only one data point per customer, this is not going to work well. I cannot emphasize enough the power of EDA for this reason. Therefore, I went the route of generating my own data based on the same data dictionary. That was a huge challenge however because I wanted to do churn prediction, survival analysis and time series clustering so had to carefully instruct the agent and iterate on the data generator to create 4 customer archetypes for my retail data which the agent named: budget concious, premium loyalist, occasional browser, and tech enthusiast. :-D Because this was a demo, I spent a lot of time iterating on synthetic data, which in the real world would be spent on actually exploring and understanding the data!
Idea 6: When using synthetic time series or time-to-event data, be careful of the time-dependent varaibles (make sure they actually vary). Data exploration and visualization will really help here which can be built into the dashboard (even temporarily). Always look at your input or raw data manually to spot check!
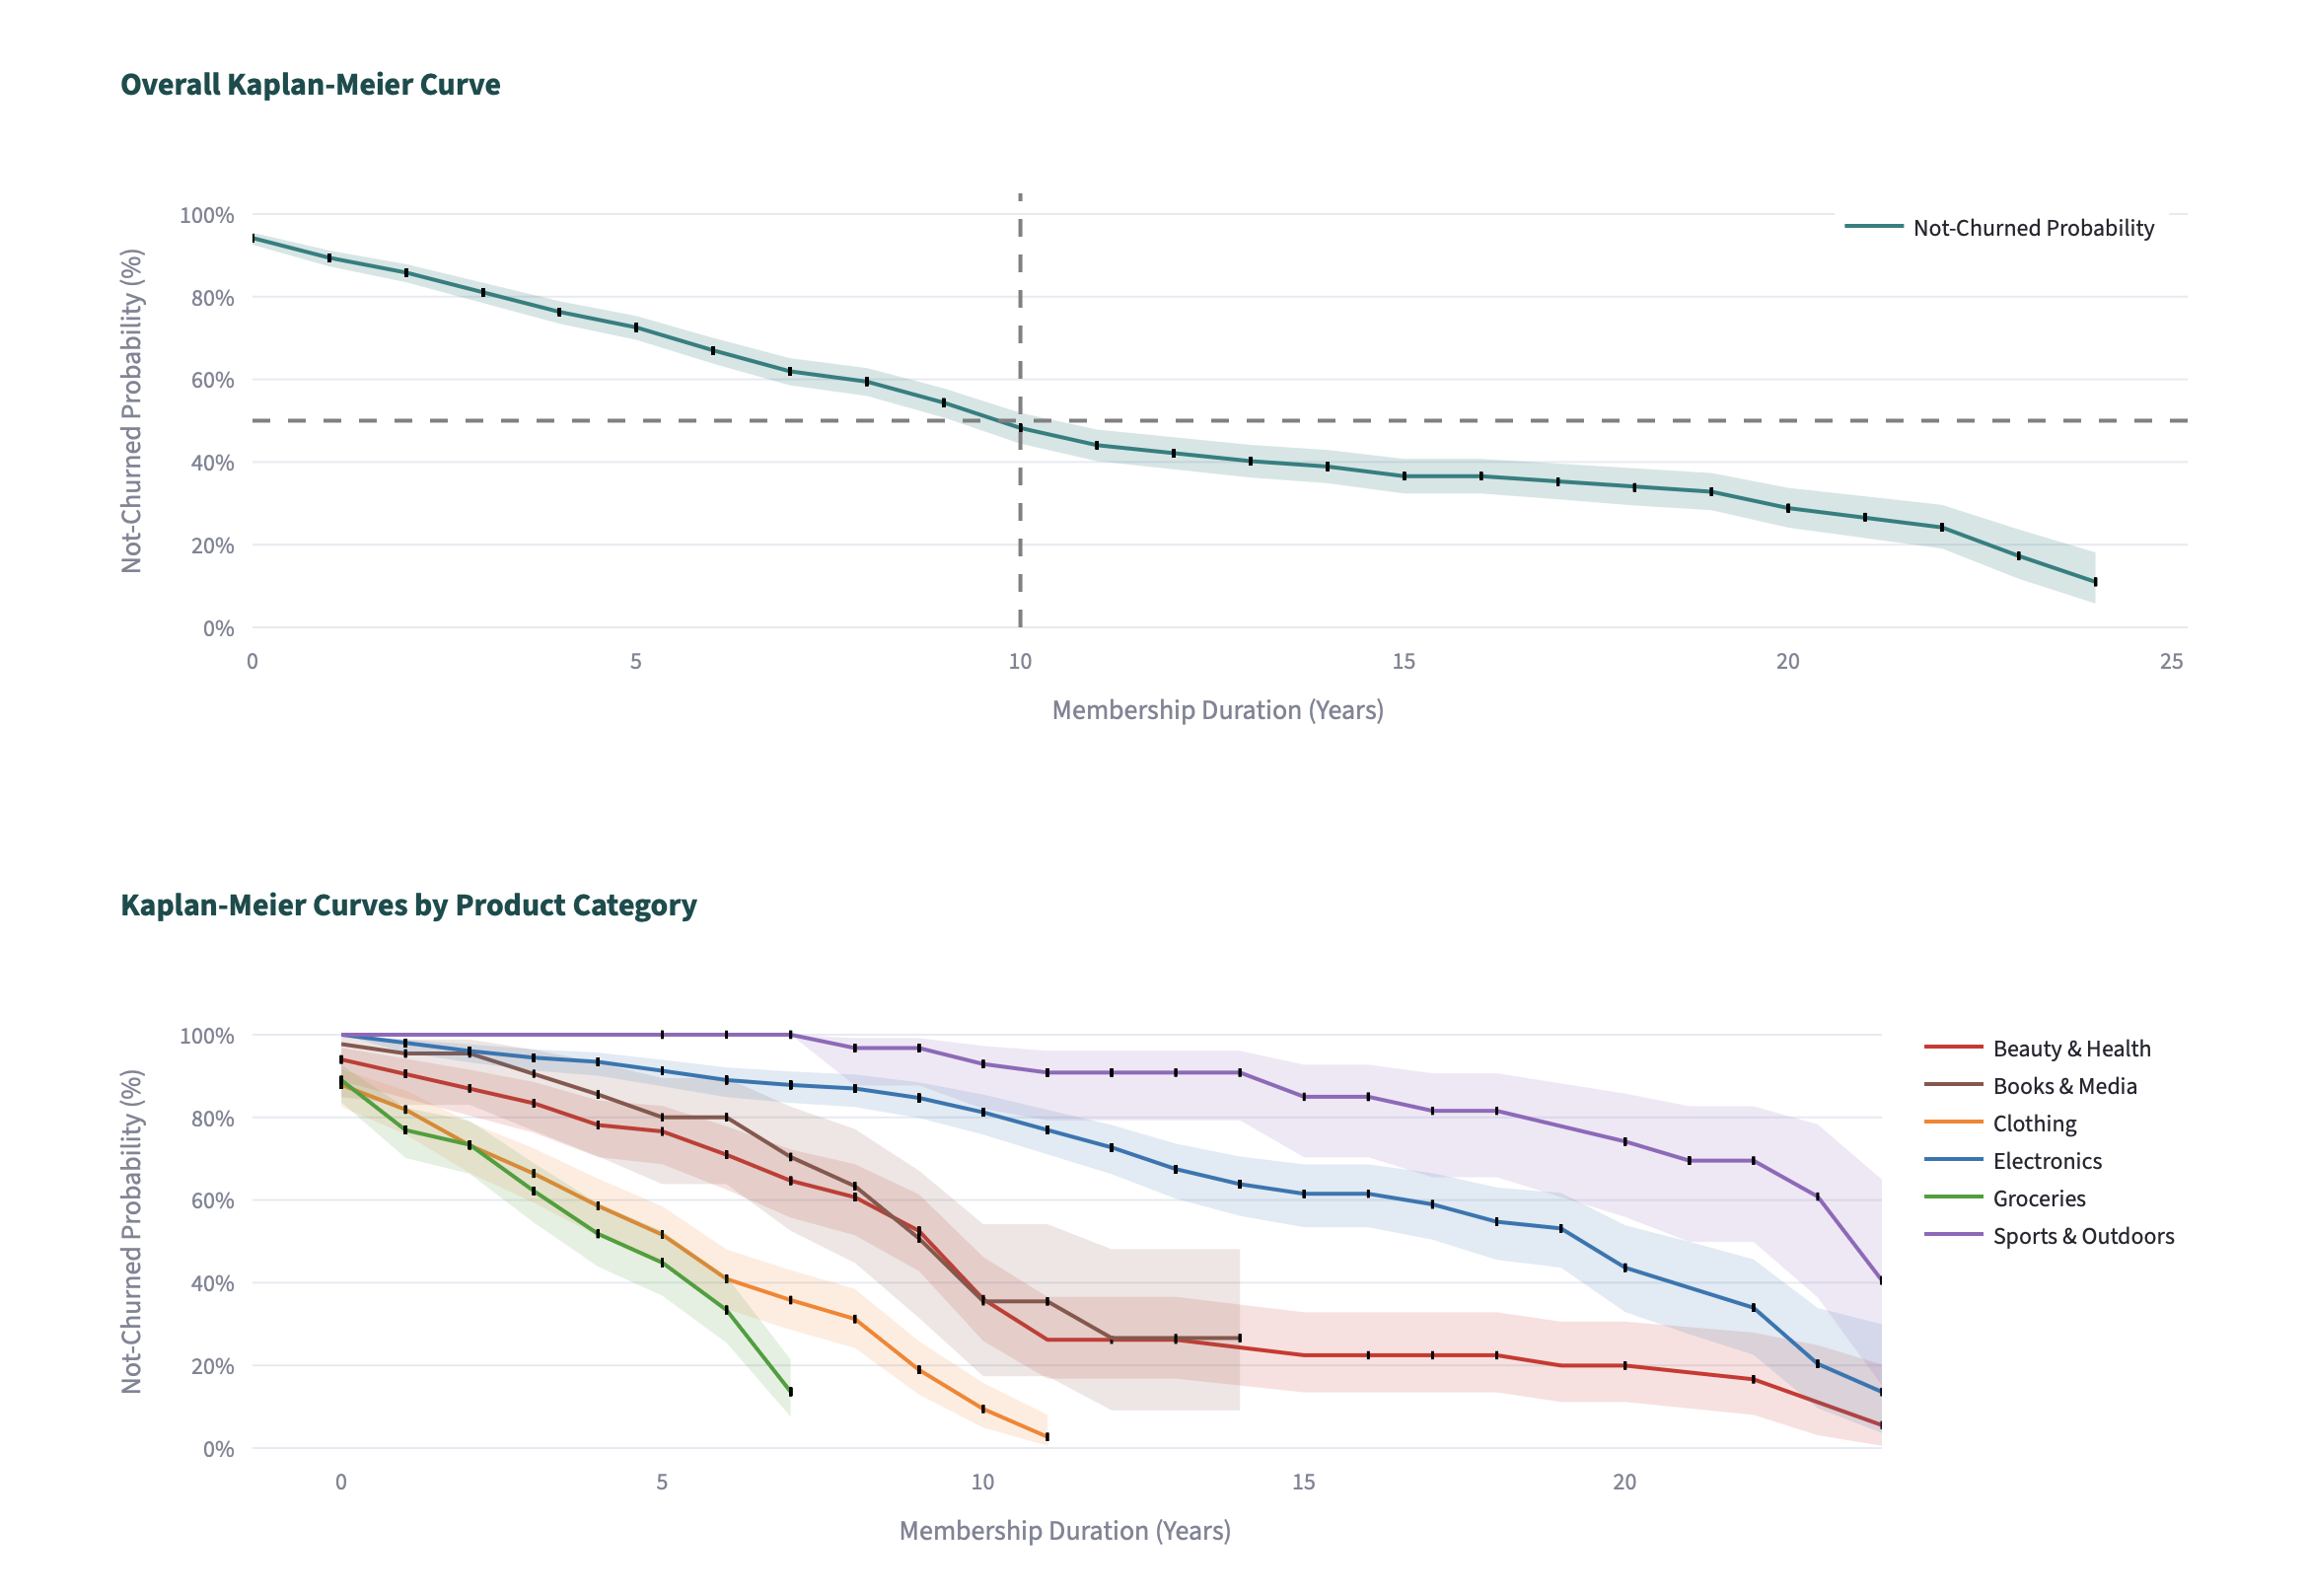
I found out that my "event" indicator was not represented correctly in the data by plotting an overall Kaplan-Meier curve and noting that the "survival probability" did not decrease very much over time, unusual for data that had almost 50% of the customers churn (my event). It was an error in the data generation it turned out. The column indicating churn, churned, had churned = "No" or churned = "Yes" as the value across all transactions for a customer instead of the "Yes"'s being only found at the last transaction. Once that was corrected for, the plots looked a little better for my synthetic data, albeit there's still room for improvement.
Coming Up
Look out for another post on how a code-generation ML algo works (for an open source one like a Qwen fine-tuned model for code generation).
What have you found out with your coding-agent experiences? Any recommendations, guidance or cautions?
BTW, here is the demo app itself running as a web app on Azure App Service: https://retail-analysis-demo.azurewebsites.net. Instructions on deploying in the GitHub repo.
Keep on reasoning.
References
- System Card: Claude Opus 4.5 (LLM used by VSCode's agent for the project)
- Streamlit documentation
- Retail demo app repo used in this article (GitHub)
- Random forests and other randomized tree ensembles in
scikit-learn - Kaplan-Meier curves and univariate survival models with
lifelines - Time Series Clustering (with
tslearn) - Installing the Azure CLI (for deployment of the app)
- Statistical Learning playlist (Stanford course on YouTube by Trevor Hastie and Rob Tibshirani)